

Big data has become one of the most valuable commodities in the world today, often termed the “new oil” of the digital revolution. This exponential growth has driven businesses to seek new ways to leverage information to make better decisions and solve problems, to truly deliver more value to their customers.
For instance, an e-commerce company will probably want to use its rapidly growing database to fulfill some of its requirements, not limited to:
- Sales-Profitability & Demand Forecasting (Sales Team)
- Supply Chain Analytics & Inventory Management (Inventory Team)
- Insights Driving A New Product Release Plan (Marketing Team)
When data grows in volume, so does the quality of generated insights. However, the byproduct that comes along with this expansion is complexity — people will find it harder to visualise the information.
Take the use case of a New Product Release Plan for example. Let’s say we begin with developing MVPs prior to building the whole product where MVPs comprise basic features. This will help us to quickly reach our customers (audience) so we can get important feedback from them, such as which feature is the most liked, and which country and/or which part of the country shows genuine interest in the product.
Not only will this feedback help us to prioritise work on the most-liked features and plan our release, it will also help us to define our product and complete our idea in a real-time scenario. If the feedback is from a smaller audience group, it’s easy to visualise them. But what if the audience is 10 million, how then, do we visualise the feedback?
Data Discovery At Your Fingertips
In order to make strategic decisions in real-time, companies need interactive dashboards that can fine-tune big data to help them with visualisation and increase productivity. At the same time, access to these dashboards should be limited to the right people when security is a cross-cutting concern.
Nowadays, more and more companies are turning to Business Intelligence (BI) tools for assistance because of their specialised offerings on designing dashboards and implementing analytics with ease. But with a huge variety of BI tools available in the market including Tableau, QlikSense, Power BI, and MicroStrategy, it is challenging to pick the right tool when you don’t have any pre-existing knowledge on them.
In this article, I will explain why Tableau is one of the most powerful business intelligence tools out there and why I recommend it. I will also guide you along on how you can set up a seamless user experience confidently with the help of trusted authentication, without showing the login page of the Tableau product.
Note: It would help if you’ve basic knowledge of Tableau Desktop and Tableau Server. It’s also a requirement that you’ve got an existing web portal where there’s a need to integrate dashboards developed (on Tableau) securely.
Why Tableau?
Most BI tools offer license-based content viewing with their own authentication to bypass security. When we want to show dashboard content on the company’s web portal which already has an existing authentication mechanism, we can bypass the tool’s OOTB authentication to provide a seamless experience while still ensuring license-based content viewing.
That being said, when I’ve done some research on these tools, I’ve found that Tableau offers greater simplicity and support, such as:
- Trusted Authentication for a seamless experience
- REST API support for automation
- Product Support
- Back Office (like administration) & Front Office (like website experience) support
In a nutshell, Tableau is all you need to provide a vivid representation of your data.
Seamless Integration
Moving on to a basic setup, let’s imagine that my development team has created 3 dashboards for their teams as sales-dashboard, inventory-dashboard, and marketing-dashboard, with access limited to respective business teams. Additionally, one of the cross-cutting concerns is that these dashboards should not be exposed to the outside world as they have confidential data.
The solution is to implement trusted authentication, which will seamlessly pull the three golden dashboards securely to your web portal. This trusted relationship between Tableau server and your web portal server ensures that when Tableau Server receives requests from you, it assumes that your web portal has already handled whatever authentication is necessary.
Tableau Terminology (skip this paragraph, if you are already familiar with them)
- Site,
- Project,
- Workbook,
- Datasource,
- View,
- Dashboard,
- Users, Groups, Roles, etc.
In the Tableau server, we can configure multiple sites and a site can have multiple projects. Logically, site and project help us to group content related to a specific segment or domain of your web portal. On the other hand, a workbook enables us to connect to a datasource, and a workbook can have various views and dashboards (a combination of views). Users and groups will be given access to these sites and their content. Groups (consisting of users) can be given specific access including roles.
Our 3 dashboards are created in a site called Boost Revenue.
How to Implement Trusted Authentication (3 Quick Steps)
(1) Add Trusted IP Address to Tableau Server — how?
Add static IP address (xx.xx.xxx.xxx) of the web portal server in Tableau server to recognise and trust requests. This is a one-time setup and straight forward.
(2) Get Trusted Ticket — how?
A client-browser will do a GET request for a ticket with the Tableau username — aneel to our web portal server. Our server should be able to send an expected POST request to the Tableau server as below and delegate this trusted-ticket back to the client browser.
e.g. Trusted Ticket
Request:
POST http://your-tableau-server/trusted?username=aneel&target_site=Boost+Revenue
Response:
9D1ObyqDQmSIOyQpKdy4Sw==:dg62gCsSE0QRArXNTOp6mlJ5
The above trusted-ticket is specific to the user aneel and the site Boost Revenue, so aneel can access only the dashboards within the site which he is given access to. And assuming he is given access to the Sales Team group.
(3) Redeem Ticket and Display the View — how?
To embed the Sales Dashboard, the iframe example snippet is as follows:
<iframe src=”http://your-tableau-server/trusted/9D1ObyqDQmSIOyQpKdy4Sw==:dg62gCsSE0QRArXNTOp6mlJ5/t/Boost+Revenue/views/workbookSales/sales-dashboard?:embed=yes" width=”800" height=”600"></iframe>
Dynamic URL breakdown: /trusted/TrustedTicket/t/SiteName/views/WorkbookName/DashboardOrViewName
- TrustedTicket: It would be different for a user and a site, when we use this ticket in an iframe, it gets redeemed and creates a Tableau server user session and an equivalent cookie in the client-browser, which is valid for 240 mins (session timeout is configurable)
- SiteName: In case we only have one site which is the default, we can even remove /t/SiteName in the URL
- WorkBookName: Assume we have a few workbooks connected to different data sources workbookSales, workbookInventory, workbookMarketing
- DashboardOrViewName: One of our three dashboards mentioned in the beginning
Do you know — Once the session is created, we can render the dashboard without /trusted/TrustedTicket in the URL even if the user goes away and traverses back to the same dashboard. We see the advantage of this when the user has given access to multiple dashboards.
I’m going to use the same ticket string as an example to ease the differentiation that’s actually changing in the URL with relation to the workbook and dashboard.
e.g. Embed Inventory Dashboard
/trusted/9D1ObyqDQmSIOyQpKdy4Sw==:dg62gCsSE0QRArXNTOp6mlJ5/t/Boost+Revenue/views/workbookInventory/inventory-dashboard
e.g. Embed Marketing Dashboard
/trusted/9D1ObyqDQmSIOyQpKdy4Sw==:dg62gCsSE0QRArXNTOp6mlJ5/t/Boost+Revenue/view
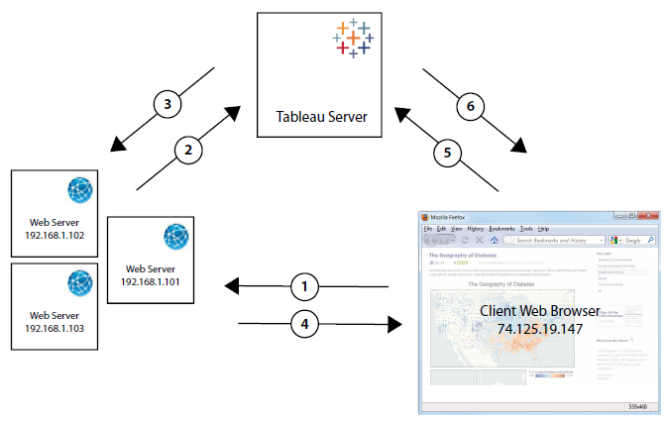
Overview of How Trusted Authentication Works
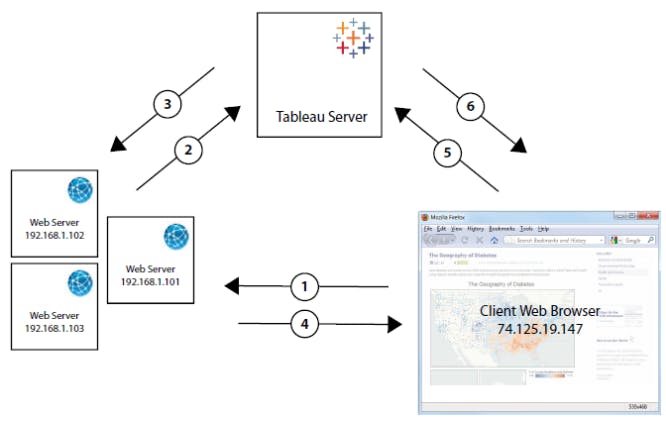
Image Credit: Tableau
How Trusted Authentication Works
In the diagram, the arrows (request-response):
2, 3 are getting the ticket from Tableau server to web server
1, 4 delegating ticket back to the client browser
5, 6 will redeem the ticket which creates a session and fetches the dashboard to iframe and gets displayed to the client
The key takeaway is to implement trusted authentication to achieve a seamless user experience. During this stage, one of the roadblocks you may encounter is our web portal, which is backed by a proxy server, doesn’t swallow a few characters present in the trusted ticket string, so you have to whitelist them with the proxy server.
When it comes to best practices, we can enhance the reliability of the Tableau server by running gateways on multiple nodes and configuring a load balancer to distribute requests across the gateways. We can also implement SSL for HTTPS traffic for data encryption. These are available as articles in Tableau Help and/or also in the Tableau Community.
Tableau: Harness the Power of Data
The developed and interactive dashboards in Tableau are now available in your existing web portal for your respective teams to enjoy. The implementation of Tableau will help you and your teams to see and understand data and at the same time, transform the way your business uses data to solve problems and deliver more impactful results.
On that final note, as the current approach is manual and limited to a fixed number of dashboards (in our case 3), the task is to automate this process of linking new dashboards available in Tableau to reflect directly in the web portal. So the best way to do this is to take advantage of Tableau’s REST API. I’ll produce a follow-up blog post on this. Until then, feel free to reach out to me with questions that you have.

