As data rapidly evolves from a competitive advantage to a necessary cornerstone of the business world, it is becoming critical for executives to understand how to leverage its full potential. From advertising insights to decision- making to customer relationship management, more than half of all companies use data for their business processes.
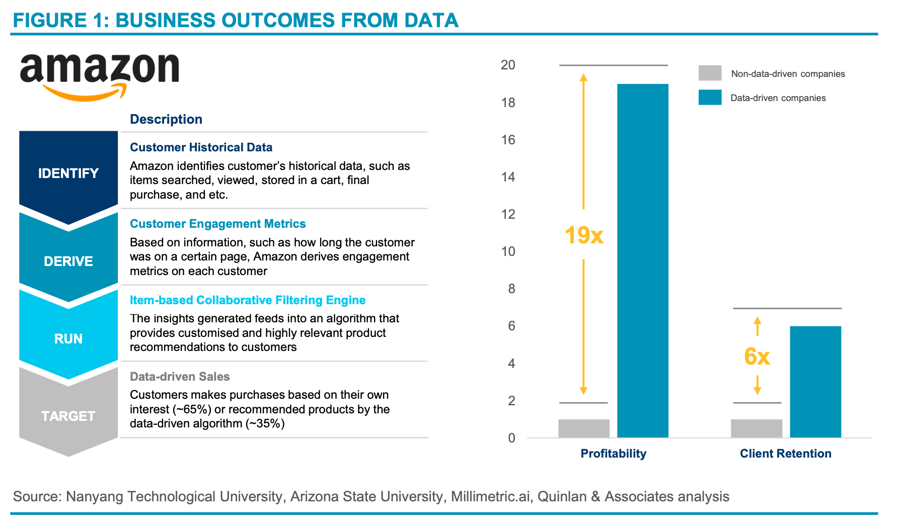
There is growing evidence that drives corporate bottom-lines. In fact, data-driven organisations are 19 times more likely to be profitable (and 6 times more likely to retain customers) than their traditional counterparts. 1
For example, Amazon’s explosive journey to number one in the e-commerce space is largely attributed to its quality customer experience; using key engagement metrics and customer history, Amazon integrates customised recommendations into every step of the purchasing process. This data system, called item-based collaborative filtering, is directly correlated with – and generates 35% of – the company’s global sales (see Figure 1).
Given the vast monetisation opportunities available, companies worldwide have invested heavily in data analytics and other data-related solutions to support their data operations. In fact, we estimate that total data-related IT expenditure worldwide is expected to reach USD 639 billion by the end of 2024, growing at a CAGR of 7.9% since 2014 (see Figure 2).
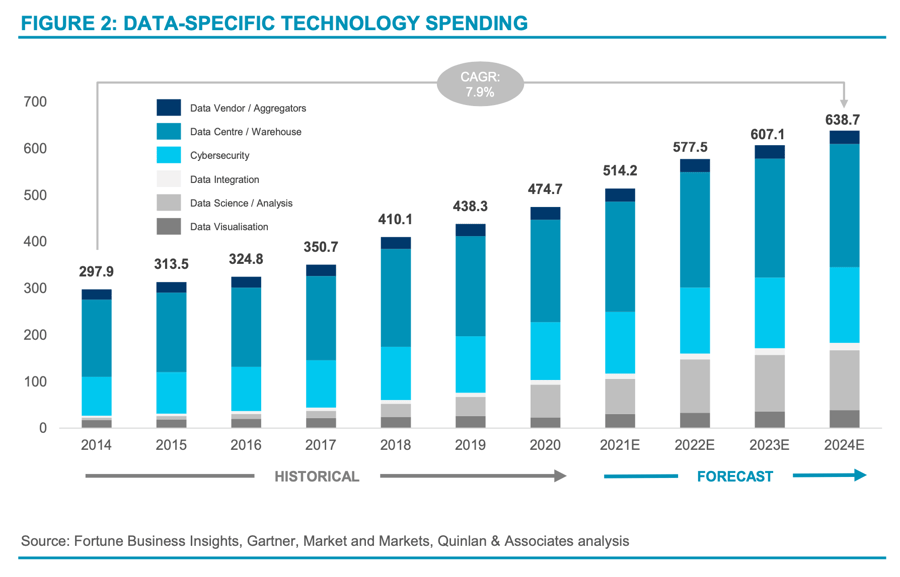
Excluding spend on cybersecurity, global data spending reached USD 350.9 billion by the end of 2020. In an ideal world, every dollar of this investment should have delivered tangible value to the companies making these investments. However, a lack of strategic metrics and granular planning of data utilisation has seen much of this spend go to waste.
Unused, unknown, and untapped data is commonly referred as “dark data”, which accounts for more than half of collected data by organisations. According to a survey of 1,300 companies conducted by TRUE Global Intelligence, 85% of the respondents stated that a lack of relevant tools to reap the full potential of the data is the primary driver of the existence of dark data, followed by incomplete information, information overload, and data accessibility. We estimate this dark data cost organisations USD 193 billion in 2020 alone, representing 55% of the total data expenditure, excluding cybersecurity spending (see Figure 3).
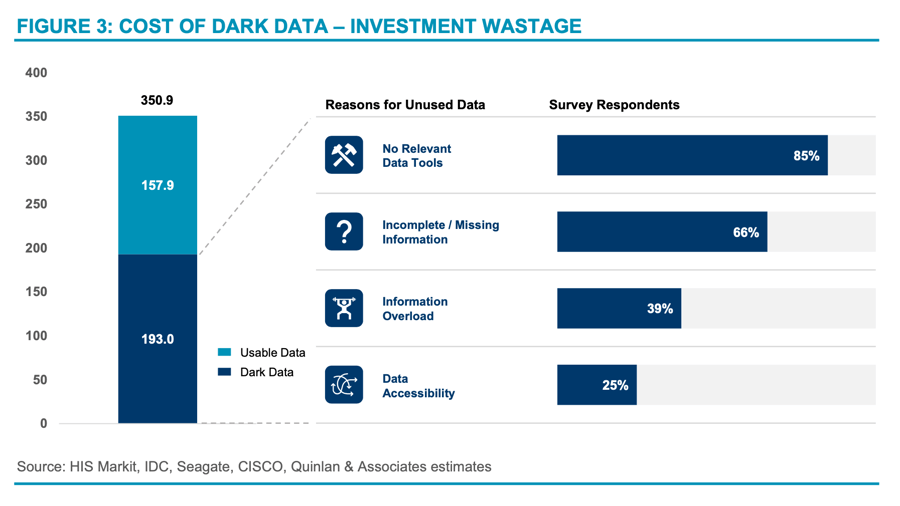
As highlighted in the figure above, the issues surrounding dark data are not solely attributed to data infrastructure; many also stem from suboptimal employee data practices (e.g. poor behaviour, lack of governance, etc.), where data is collected, stored, and managed without consistent standards. These inconsistencies (and a lack of completeness) results in considerable deadweight loss, as critical business decisions can be delayed (or even completely misguided) due to inaccurate, unreliable, irrelevant, and untimely data insights.
The cost of imperfect data
A study was conducted by Harvard Business Review (“HBR”) with the objective of measuring the data quality score of multiple firms by counting the number of error-free records at a company. HBR found that only 3% of data met the acceptable quality standards; 2 in other words, 97% of data collected needed to be recovered by revisiting, consolidating, cleaning, and correcting them to become business relevant and ready for use. The cost of was found to be approximately “ten times as much to complete a unit of work when the data is flawed in any way compared to when the data is perfect.” 3
With 97% of records subject to some form of data recovery, and maintenance costs for this data being ~10 times more than a vanilla data maintenance costs, we estimate organisations worldwide wasted USD 1.5 trillion in managing imperfect data in 2020 alone (see Figure 4). 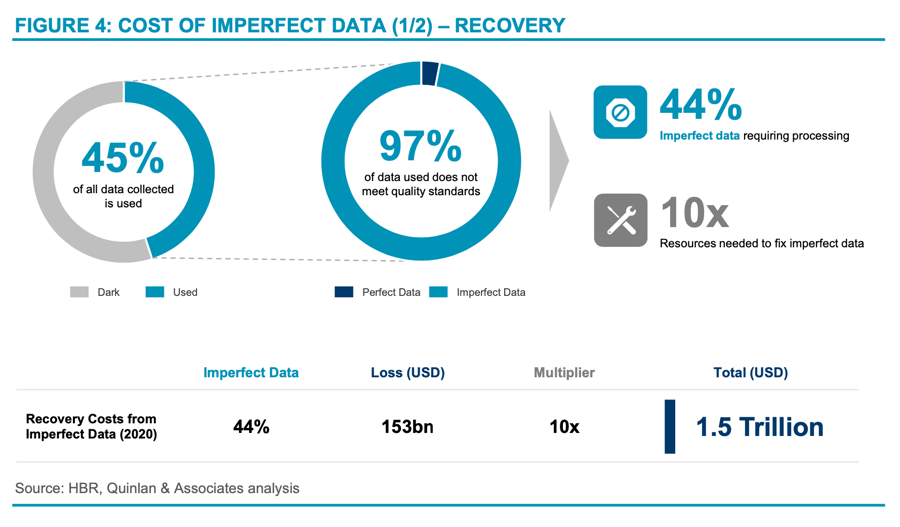
As highlighted in Part 1 of this two-part report series, the primary driver of these losses is a fundamental lack of understanding of the data value chain, with most companies focusing on: (1) collecting masses of information without a structured approach; and (2) processing it with patchwork enhancements to fit a specific algorithm. Additionally, to fully understand data, having a good grasp of underlying technologies (e.g. data architecture, infrastructure, etc.) and applications (e.g. visualisation tools, decision- making tools, etc.) is important as data should not be considered in a silo, but as part of a full value chain.
Four business goals & data
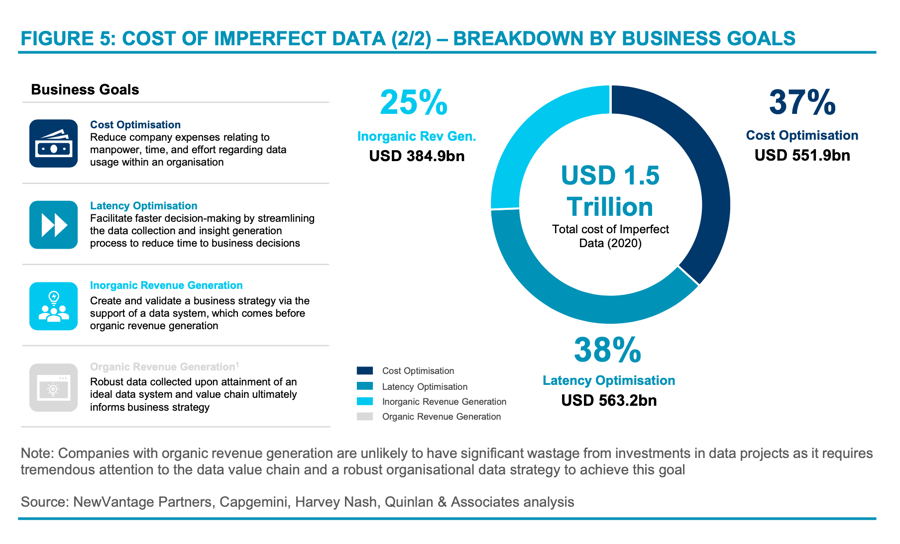
As the saying goes, “The road to hell is paved with good intentions”. And it is undoubtedly true that most companies start out with the best intentions when it comes to utilising data. Businesses typically look to utilise data in an effort to accomplish four main business goals, namely:
- Cost Optimisation
- Latency Optimisation;
- Inorganic Revenue Generation; and
- Organic Revenue Generation.
In the process of accomplishing these goals, inadequate strategic planning and execution can lead to subpar results in the form of substantial financial losses. We have found that when these four business goals and respective journeys go awry, they contribute significantly to the cost of imperfect data in organisations (see Figure 5).
These business goals can be further separated into two main categories: (1) internal goals; and (2) external goals (see Figure 6).
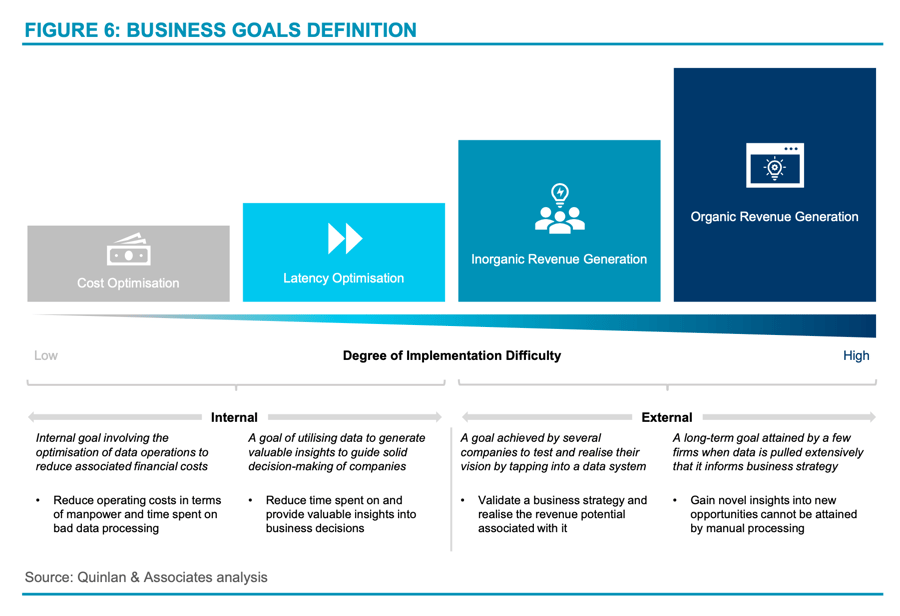
1. Internal: cost-optimisation
As mentioned earlier, many businesses spend considerable time recovering or making data ready for downstream usage. The hourly cost of manpower skyrockets when staff are forced to waste additional time and effort collecting disparate data points from a variety of sources (or painstakingly creating additional processes to parse data when it could have been collected and stored properly to begin with). This represents the first internal business goal of optimising for costs, based on time or money spent on bad data processing.
2. Internal: latency optimisation
Another key internal goal of many businesses is reducing latency in decision-making. This is not to be confused with cost optimisation, which can include employee time spent on data recovery. Instead, this goal looks at utilising data to generate fast business decisions on the fly, from the point of data ingestion within an organisation to insight delivery at the end of the process.
Some companies may already have a data process in place, where critical information is passed to management for executive decision- making. Any latency generated in this process (from collection to insight generation) could seriously hamper quick decision making and, by extension, blunt a firm’s competitive edge. Unless this is resolved, the problem typically compounds over time, leaving many organisations trailing their competition in an increasingly digitally focused world.
This problem can be frequently seen in the retail industry. Company management typically relies on their distributors to collect and feed sales data back to headquarters. A significant amount of time is then spent collating and analysing this data before any meaningful insights can be generated. In fact, we typically see companies reviewing sales records quarterly (or monthly, at best).
Assuming perfect execution of data collation, after taking these quarterly insights and creating a tactical shift for a product, a few additional weeks has passed, such that management needs to make decisions based on only a handful of major data points each year. While better than semi-annually or yearly, it certainly does not hold up in today’s fast- paced business world, where pivots may need to be made on a weekly, daily or even real-time basis.
3. External: inorganic revenue generation
Executives often have hunches and a sense of how to steer their business in a rapidly changing landscape based on their experience. However, while undoubtedly valuable, these perspectives should be verified by data to either strip away personal biases or solidify instincts, forming part of a cohesive business strategy.
A good example of this is a company looking to offer new products through improving its use of data and digital solutions. Take Netflix: while it began as a DVD-by-mail service back in the late 1990s, it pivoted into streaming services in 2007. With this move, Netflix broadened its user base and began collecting a significant amount of information around its viewership habits and preferences.
Netflix subsequently utilised this data generated from its pre-existing business in two primary ways, namely: (1) the identification of new opportunities; and (2) as leverage for studio negotiations. Addressing the first point, Netflix had created customer metrics (i.e. when viewers play, pause, and rewind, when they watch content, device preferences, and location data, etc.) 4 and identified shows and genres that its viewers desired. This provided them with unique insights into targeted licensing from large studios, saving significant amounts of capital (as opposed to the shotgun approach of “license anything we can”). Secondly, its monopoly on viewership data has given Netflix an outsized advantage when negotiating with studios for subsequent licensing or production deals. 5
In summary, Netflix created a new core product (streaming) and fundamentally changed its business model; creating efficiencies around capital allocation (targeted licensing) and yielded tremendous revenue growth. All of this was possible through the company’s devotion to robust data collection and analysis. Additionally, this created a hoard of data for Netflix to utilise which transitioned the company into the summit of any company’s data journey, complete organic revenue generation.
4. External: organic revenue generation
Organic revenue generation occurs when big data begins to develop insights that can directly point a company towards the best way of making more money. In this case, datasets become so large – and analysis so robust – that it begins to develop perspectives from blind spots that manual processing is unable to achieve. As highlighted in Part 1 of our two-part report series, this is quite a rare scenario, as businesses would need to have such an efficient (and effective) end-to-end data value chain that all data is automatically and readily accessible (and usable) to generate insights from novel questions that decision-makers may have.
In the case of Netflix, the company created a recommendation engine that dynamically alters the movies shown on its landing page, tailored to individual user behaviours. This manifested in an attractive user-centric functionality. While a fantastic feat of engineering, Netflix’s recommendation engine is only a front to the true intricacy of the company’s data prowess; the ability to create curated content based on viewership preferences. The sheer amount of data Netflix sits on means that it can generate a profile of a movie or TV show that has yet to be produced but has immense potential with its current audiences.
A prime example of this could be seen with its hit series, ‘House of Cards’, which gave Netflix management the direction they needed with the following viewer insights: (1) David Fincher’s a ‘Social Network’ was frequently watched from start to finish; (2) the British version of ‘House of Cards’ was well received; and (3) viewers who enjoyed these two series also enjoyed Kevin Spacey and/or films directed by David Fincher. 6
Netflix went on to invest USD100 million into the series, which has since been credited with cementing the company’s dominance in the streaming space, with other hit series launched in the same manner. 7
Today, Netflix has a plethora of curated movies and TV series which are not available anywhere else, creating a significant strategic advantage for Netflix and a defensible revenue stream, a clear testament to the power of a tightly managed and holistic data strategy.
Goals dimensions
As highlighted earlier in this report, companies waste significant sums of money in data project investments, largely due to an incomplete understanding of the specific business problems they are trying to address.
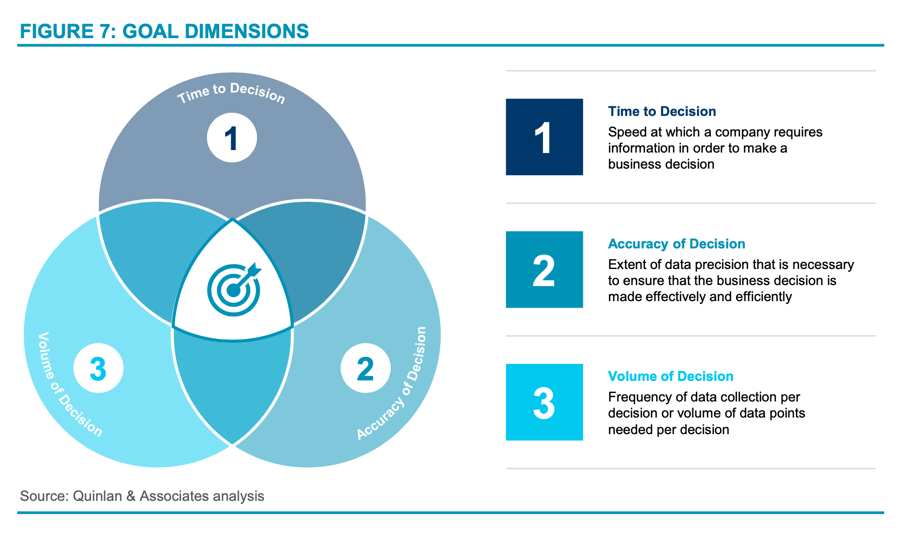
There are three key dimensions that firms should consider when deciding what level of investment is necessary, centred around the business use case. These include:
- Time to decision (how fast does the company require information);
- Accuracy of decision (how precise does it need to be?); and
- Volume of decision (how many times does information need to be gathered and how many data points are required?) (see Figure 7).
Let’s conceptualise this in a simple case study: if a bank wishes to update a customer on their investment portfolio each quarter, the bank will need to collect portfolio movements from the last three months, parse it for the customer in question, and visualise it for them. This is a low frequency process that does not need to be collected at speed. However, it should be incredibly precise, given that the accuracy of the reported portfolio could affect a customer’s future decisions.
If we were to map these requirements into the three dimensions, we would require a data system that pulls data infrequently from a few sources, is highly accurate, and scales to meet the size of the bank’s customer base. The bank would, in essence, not need to invest in an overly complex system that pulls data in real- time or conducts in-depth analysis or visualisation.
It would, however, need a system that scales quickly to new customers and can handle a large inflow of information in a small window of time. While oversimplified, this logical thinking can be applied to large or small business use cases; building for what is needed with a bit of headroom, saving significant overheads, and freeing capital to be allocated to other projects as the company sees fit.
Conclusion
Thanks for reading part 1 of our ongoing series on data strategy. For the full report, be sure to check out our recent whitepaper in collaboration with Quinlan & Associates, The Real Lingua France: Unlockin the Power of Data.
For more information on how you can make the most out of your investment in data, feel free to reach out to the authors, Jung Hong Kim, Jing Lei, Benjamin Quinlan, Charles Yau or Justin Chung.
Or, reach out directly to PALO IT to learn more about digital transformation as a whole.

Sources
1 Millimetric.ai, ‘ What To Do When There’s Too Much Data’, available at: https://www.millimetric.ai/2020/08/10/data-driven-to-madness- what-to-do-when-theres-too-much-data/
2 Harvard Business Review, ‘Only 3% of Companies’ Data Meets Basic Quality Standards’, available at: https://hbr.org/2017/09/only-3- of-companies-data-meets-basic-quality-standards
3 Harvard Business Review, ‘Assess Whether You Have a Data Quality Problem’, available at: https://hbr.org/2016/07/assess-whether- you-have-a-data-quality-problem
4 The Netflix Tech Blog, ‘Netflix Recommendations: Beyond the 5 stars (Part 2)’, available at: https://netflixtechblog.com/netflix- recommendations-beyond-the-5-stars-part-2-d9b96aa399f5
5 New York Times, ‘Sony Pictures enters a streaming deal with Netflix’, available at: https://www.nytimes.com/2021/04/08/business/sony-netflix-streaming-deal.html
6 New York Times, ‘Giving Viewers What They Want’, available at: https://www.nytimes.com/2013/02/25/business/media/for-house-of- cards-using-big-data-to-guarantee-its-popularity.html?pagewanted=all&_r=0
7 CNN Money, “’ House of Cards’ made Netflix a powerhouse. What now?”, available at: https://money.cnn.com/2017/11/01/investing/netflix-stock-house-of-cards-kevin-spacey/index.html