
User research is a vital step in the design process. It is an investigation into your users - understanding their needs, behaviours, attitudes,and pain points. In order to communicate that, a research report is a key deliverable. These reports can inform the design process by helping designers and stakeholders understand where their product can improve to meet user needs.
If you’re familiar with user research, you’ll be well aware of the challenge of coming up with a research report. You spend days synthesising and piecing together a 40 page deck. Then after an hour long presentation, how many people would actually bother to read it? Even if they wanted to, where would they find them? A 14MB pdf report isn’t exactly easily accessible.
And when Covid came, I knew I had to get creative. I started developing a system to help me keep track of the conversation, share with my colleagues, and ultimately make synthesis a lot easier.
In this blog post, I will be sharing my experience of using virtual post-it notes to capture feedback, thoughts and more in remote usability testing. Let’s dig in.
Step 1: Choose your weapon
With so many collaboration tools out there, you’re going to be spoilt for choice. I’ve personally used Miro and Whimsical, and I believe both are excellent in engaging remote teams on a virtual whiteboard without constraints. But if you’re already fully onboarded onto Figma, it feels natural to extend the use of the tool to usability testing as well.
Tip! Pick a tool which all your stakeholders have easy access to. Remember, research is truly powerful only when socialised and utilised.
Step 2: Create a central research hub
Now that you’ve selected a tool. We can jump into setting up the insights board. I’ve chosen to group all usability insights into a single page/board. This will allow me to retain a history of insights from my project.
Step 3: Setting up
Just like any report, you’ll need an intro segment. Here is where I’ll place a participant legend, and an overview of screens and tasks covered.
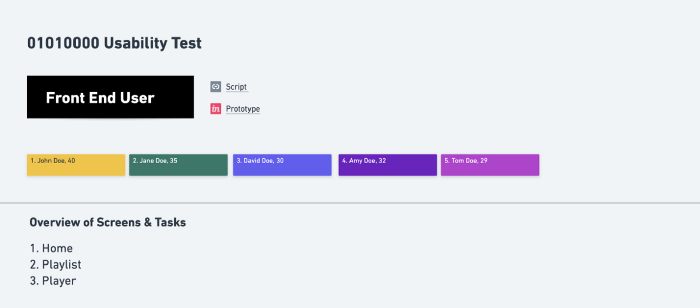 Use this section as introduction for your audience
- Participant legend: Assign a single colour to each participant. This will help track who said what.
- An overview of screens: Provide the audience some context of the test you ran.
Step 4: Split into sections and start taking notes
One final step I like to do before the testing session is to organise my prototype by screens / tasks. This allows the audience to have something visual to refer to.
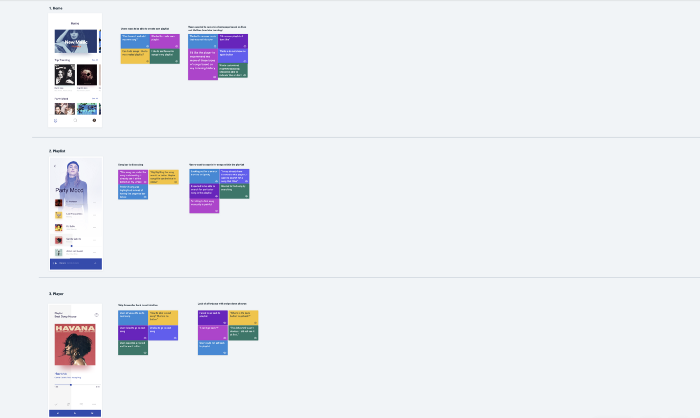 Split note taking by screens based on your overview
Step 5: Synthesising and Recommendations
I synthesised my report simply by forming clusters around a specific feature and coming up with an overarching statement.
A good report is not complete without actionable recommendations. More often than not, you need buy-in from specific stakeholders. To help facilitate that, I created 3 categories- business decision, development feasibility, or UX/UI fix. You want to place this beside your insight so that it’s easily identifiable. This is also great for quick and dirty prioritisation.

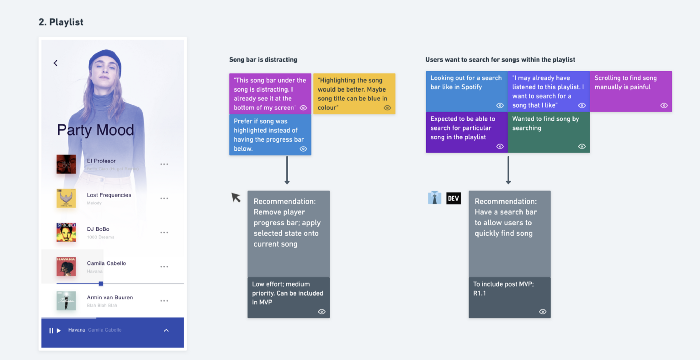 Insights synthesised, clustered with recommendations
Conclusion
And that’s it! Using an online whiteboard empowers every step of the research process, enabling you and your team to work better online. It makes note-taking information seamless, helps to cluster and synthesise insights effortlessly, facilitates better collaboration on a presentation, and finally, allows you to share your data with everyone without losing a thing.
More importantly, having a clear and actionable presentation goes a long way to helping your team develop better and more impactful solutions that you can eventually deliver.